
Roofing Careers
Roofer Salary in 2026: What the BLS Data Actually Shows
Published August 2026 · Updated August 2026 · 10 min read
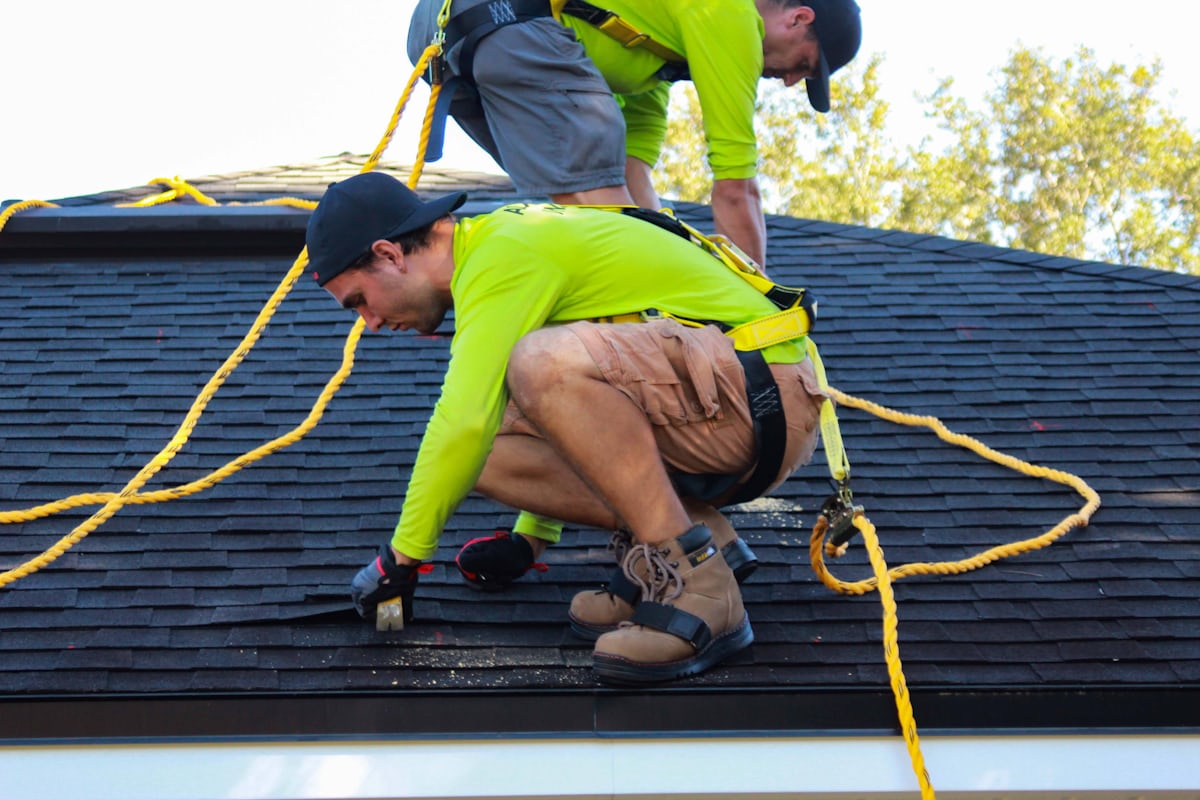
The median roofer in the United States earns $55,440 a year — $26.65 per hour worked. That is the lowest median of the four major building trades, below plumbers at $63,800, electricians at $63,190, and HVAC technicians at $61,010. But the median is the least interesting number here: the top 10% clear $81,720, and the gap between the best- and worst-paying states is $34,220 — a wider relative spread than any other trade in this data.
Every figure here comes from the Bureau of Labor Statistics Occupational Employment and Wage Statistics survey for May 2025, released in 2026, for SOC code 47-2181 — roofers. We pulled it from the BLS API directly rather than repeating secondary sources, which are unusually wrong on this occupation. Want to run your own numbers? Use the roofer salary calculator for state and experience level, or compare all four trades side by side.
The National Numbers
Across 135,490 roofers employed nationally:
- Median annual wage: $55,440 ($26.65/hr)
- Mean annual wage: $58,140 ($27.95/hr)
- 10th percentile: $37,460 ($18.01/hr) — helpers and first-season labourers
- 25th percentile: $46,260 — installers still building speed
- 75th percentile: $65,390 — senior installers, crew leads
- 90th percentile: $81,720 ($39.29/hr) — commercial and industrial roofers, foremen, union markets
The mean sits above the median, which tells you the distribution is pulled upward by a well-paid minority rather than being evenly spread. In practice that minority is commercial roofing, prevailing-wage work, and supervision. Note also that these are wage figures for employed roofers — they exclude owner-operators, whose income is business profit rather than a wage and does not appear in this survey at all.
What Is the Average Roofer Salary?
The average roofer salary is $58,140 a year ($27.95 an hour). The median is $55,440 ($26.65 an hour). Both are correct — they answer different questions, and most salary sites quote one while labelling it the other.
- Average (mean) — $58,140. Total wages divided by the number of roofers. Commercial roofers, foremen, and union-market crews earning $81,720+ pull it upward.
- Median — $55,440. The midpoint: half of roofers earn more, half earn less. This is the better answer to “what should I expect to earn.”
The $2,700 gap between average and median is the narrowest of the four building trades — roughly a third of the spread in plumbing. That is worth reading carefully, because it is not good news. A tight distribution means roofing wages cluster near the bottom with little room to climb on wage alone: the trade’s 90th percentile ($81,720) is lower than plumbing’s 75th. The realistic upside in roofing is commercial and prevailing-wage work, or moving to the ownership side, where income is business profit rather than a wage and does not appear in this survey at all.
How Much Do Roofers Make Per Hour?
The median roofer earns $26.65 an hour and the average is $27.95. The bottom 10% earn $18.01 — helpers and first-season labourers — and the top 10% earn $39.29 or more. One caveat specific to roofing: these are annual wage figures divided into hours, and roofing is more weather-exposed and seasonal than the other trades, so hourly rate and actual annual take-home diverge more here than they do in plumbing or HVAC.
Why Roofing Pays Less Than the Other Trades
The $8,360 gap between roofers and plumbers at the median is not about difficulty or risk — roofing has one of the highest injury rates in construction. It comes down to three structural facts:
- Licensing restricts supply everywhere except roofing. Plumbing and electrical work require individual state licenses gated behind multi-year apprenticeships. Most states require a contractor license to run a roofing business but no journeyman license to install — so the labour pool is far easier to enter. See how contractor licensing works by state.
- Weather caps annual hours. An hourly rate only becomes an annual salary if you work the hours. Rain days, heat, and winter shutdowns in northern markets remove weeks that a service plumber never loses.
- Residential shingle work is priced by the square. It is the largest segment, the most competitive, and the most transparent to homeowners — which compresses what any contractor can pay and still win bids.
The useful consequence: the trades converge at the top. At the 90th percentile roofing reaches $81,720 against $108,420 for plumbers — a much narrower gap than at the median. Roofing pays badly for generic labour and competitively for specialisation.
Roofer Salary by State
24 of 51 states and the District of Columbia pay above the national median. The top of the table:
| State | Median | 90th pct | Employed |
|---|---|---|---|
| Illinois | $77,900 | $106,530 | 5,300 |
| New Jersey | $76,600 | $103,720 | 1,860 |
| Minnesota | $74,490 | $99,170 | 1,890 |
| Massachusetts | $72,750 | $106,290 | 1,950 |
| Alaska | $66,750 | $92,450 | 310 |
| New York | $66,020 | $95,040 | 4,570 |
| California | $63,600 | $89,010 | 21,190 |
| Connecticut | $62,070 | $96,070 | 790 |
| District of Columbia | $61,750 | $101,570 | 100 |
| Rhode Island | $61,630 | $93,740 | 360 |
Illinois leads at $77,900, with New Jersey ($76,600) and Minnesota ($74,490) behind it. At the bottom, Oklahoma pays $43,680 — a $34,220 spread.
The striking pattern is that volume and pay run in opposite directions. Florida employs the most roofers in the country at 23,550, but its median is $47,590 — well below the national figure. California is second on headcount at 21,190 and does pay above median at $63,600. The high-paying states are cold-climate, heavily unionised markets with a larger commercial share and a compressed season. If you are picking a market on pay rather than volume, that is the signal to follow.
Where the Ceiling Is Highest
Median pay tells you what a typical roofer earns; the ratio between a state's 90th percentile and its median tells you how much room there is to climb. The widest ceilings:
- Oklahoma: median $43,680, 90th percentile $81,720 — 1.87× the median
- Louisiana: median $48,760, 90th percentile $84,590 — 1.73× the median
- Kansas: median $47,190, 90th percentile $81,540 — 1.73× the median
- Washington: median $60,640, 90th percentile $104,000 — 1.72× the median
A high ratio usually means a two-tier market: a large low-paid residential segment alongside a smaller commercial or industrial one paying far more. For an installer, those states reward moving into the commercial side more than almost anywhere else. For a contractor hiring in them, the median is a misleading benchmark — your competition for experienced crews is the upper tier, not the middle.
Pay by Specialty and Role
BLS does not break SOC 47-2181 down by specialty, so the figures below are SubcontractorHub estimates from contractor pay data, expressed as a premium over the state median. They are estimates, not BLS statistics.
- Residential shingle installer: at or slightly below the state median
- Commercial low-slope (TPO, EPDM, modified bitumen): roughly 20–35% above
- Metal roofing installer: roughly 15–25% above — a smaller trained pool, and metal systems keep taking residential share
- Crew lead / foreman: roughly 25–40% above
- Estimator / project manager: often above the 90th percentile; this is where the trade's real earnings ceiling sits
- Service and repair specialist: 10–20% above, and far less seasonal than replacement work
Keep Crews Working — the Real Pay Lever in Roofing
SubcontractorHub is the platform roofing contractors use to quote, finance, and run every job. Crews leave companies where weather, material delays, and rework cost them billable days — not usually over a dollar an hour. Tighter scheduling and faster approvals are a raise nobody has to fund.
Book a DemoWhat Roofing Contractors Should Actually Pay
If you are setting crew pay rather than earning it, three things in this data matter:
- Benchmark to your state's 75th percentile, not the national median. Nationally that is $65,390 against a $55,440 median — about an 18% premium to sit in the upper quartile. In a Illinois-style market the national median is not even a serious offer.
- Cost the wage, not the rate. Payroll taxes, workers' comp — brutal in roofing — insurance, and vehicles typically add 25–40% on top. The labor burden calculator gives you the loaded number to bid from, and the roofing labor cost calculator converts it to a per-square figure.
- Billable days beat hourly rate for retention. An installer losing three weeks a year to scheduling chaos and rework is taking a real pay cut regardless of the posted rate. That is an operations problem, and it is cheaper to fix than a raise.
Roofing also has the shortest ramp of the four trades — a helper can reach productive installer pay in one to two seasons rather than the four to five years an apprenticeship takes elsewhere. That is a genuine recruiting advantage when you are competing with electrical and plumbing for the same young workers, and it is worth saying out loud in a job ad.
Frequently Asked Questions
How much do roofers make?
The median roofer in the United States earns $55,440 a year, or $26.65 per hour, according to BLS Occupational Employment and Wage Statistics for May 2025. The bottom 10% earn under $37,460 and the top 10% clear $81,720. That median is the lowest of the four major building trades — plumbers are at $63,800, electricians $63,190, and HVAC technicians $61,010 — but the gap narrows sharply at the top of the scale, and roofing has the shortest path from helper to full production pay.
What state pays roofers the most?
Illinois pays the highest roofer median at $77,900, followed by New Jersey at $76,600, Minnesota at $74,490, and Massachusetts at $72,750. The spread between the highest and lowest state median is $34,220 — Oklahoma sits at the bottom at $43,680. The pattern is not cost of living alone: the top states are cold-climate, heavily unionized markets where commercial and industrial roofing is a bigger share of the work and the season is compressed, which pushes hourly rates up.
Do roofers make good money?
It depends entirely on which part of the trade you are in. A residential shingle installer in a warm-weather market working at the state median is earning in the mid-$40,000s. A commercial roofer running single-ply or built-up systems in Illinois or New Jersey, or a foreman in a union market, is realistically in the $75,000 to $105,000 range. The 90th percentile nationally is $81,720. Roofing rewards specialization and supervision more steeply than it rewards time served.
Why do roofers earn less than plumbers and electricians?
Three structural reasons. First, licensing: plumbing and electrical work require state licenses with multi-year apprenticeships that restrict supply, while roofing in most states requires a contractor license to run a business but no individual journeyman license to install. Second, seasonality: roofing work is weather-dependent, so annual earnings absorb lost days that a service plumber does not lose. Third, the residential shingle segment is large, competitive, and priced by the square, which compresses labor rates. The trades converge much more closely at the 90th percentile than at the median.
How much do commercial roofers make compared to residential?
BLS does not split SOC 47-2181 by segment, so there is no official figure. Based on contractor pay data, commercial roofing crews running TPO, EPDM, modified bitumen, and built-up systems typically earn 20% to 35% more than residential shingle crews in the same market — the work involves more equipment, more certification, and more prevailing-wage and union jobs. Treat that range as an estimate, not a BLS statistic.
What should a roofing contractor pay to keep good crews?
Pay the 75th percentile for your state, not the median, for anyone you want to keep past two seasons. Nationally the 75th percentile is $65,390 against a $55,440 median — roughly an 18% premium to be in the upper quartile. The bigger retention lever in roofing is not the hourly number but the number of billable days: crews leave markets and companies where weather, material delays, and rework cost them weeks. Consistent scheduling is worth more than a dollar an hour to an experienced installer.
How long does it take to become a roofer?
Roofing has the shortest ramp of the major trades. Most roofers learn on the job, and a helper can reach productive installer pay in one to two seasons rather than the four to five years an electrical or plumbing apprenticeship takes. Formal apprenticeships exist — typically three years combining paid work with classroom hours — and are most common in union commercial markets. The tradeoff is that the low barrier to entry is part of why the median sits below the other trades.
Which state has the most roofing jobs?
Florida employs the most roofers by a wide margin at 23,550, followed by California at 21,190. Neither is a top-paying state — Florida's median is $47,590, well below the $55,440 national figure. Storm activity and replacement demand drive volume in Florida, but the residential shingle mix and a large contractor population keep rates compressed. Volume and pay are close to inversely related across the state data.
Data Sources
U.S. Bureau of Labor Statistics, Occupational Employment and Wage Statistics (OEWS), May 2025 release, SOC 47-2181 — Roofers. National percentiles and state annual medians, 90th percentiles, and employment counts retrieved via the BLS public API. Cross-trade comparison figures are the same OEWS release for SOC 47-2111 (electricians), 49-9021 (HVAC), and 47-2152 (plumbers). Specialty and role premiums are SubcontractorHub estimates from contractor pay data and are labelled as estimates throughout — BLS does not publish wages by specialty within SOC 47-2181. Figures cover employed roofers and exclude owner-operator business income.
Related Resources
- Roofer Salary Calculator — by State & Experience
- Trade Salary Comparison — All Four Trades by State
- Metal Shingles: Cost, Lifespan & Whether They Are Worth It
- How to Get a Contractor License in 2026
- How to Start a Roofing Business
- HVAC Technician Salary in 2026
- Roofing Labor Cost Calculator
- SubcontractorHub for Roofing Contractors
SubcontractorHub
See How Top Contractors Close More Jobs
AI proposals, sales pipeline, and project management — all in one platform.
- ✓AI-powered proposals in the field
- ✓CRM built for contractor sales
- ✓Project tracking from sale to install
30 minutes. No commitment.